Results

We have merged risk management, profitability and sustainability to provide consistent results and financial gain.

The strict risk management means on average, we risk only 0.02% per each trade and 0.5% of the total capital daily, (the risk percentages can change and could be affected due to volatility within the markets.)

Most Recent Results of 2024

Most Recent Results of 2023

Over 80%

The growth reached over 80% in the first 6 months and is continuously increasing.

Intro
Intro

Profit chart

Profit chart from March – September shows a consistent and smooth increase each month.

Intro

80:20 Profit to Loss ratio, meaning 80% of trades will close in profit. This ratio applies on an hourly basis as well as weekly.

Intro

Drawdown - refers to the difference between a high point in the balance of your trading account and the next low point of your account's balance. It shows how much a trading account is down from the peak before it recovers back.

Return Statistics 2021/22

Intro

Below are the results we achieved on a Monthly basis from March 2021 - March 2022

March 2021

April 2021

May 2021

June 2021

July 2021

August 2021

September 2021

October 2021

November 2021

December 2021

January 2022

February 2022

March 2022

Zero Upfront Fees

Benefit from Free trial program and get Zero Upfront Fees if you are eligible for our freeĀ trialĀ program

Intro
Intro

Our Automated Traded Strategy

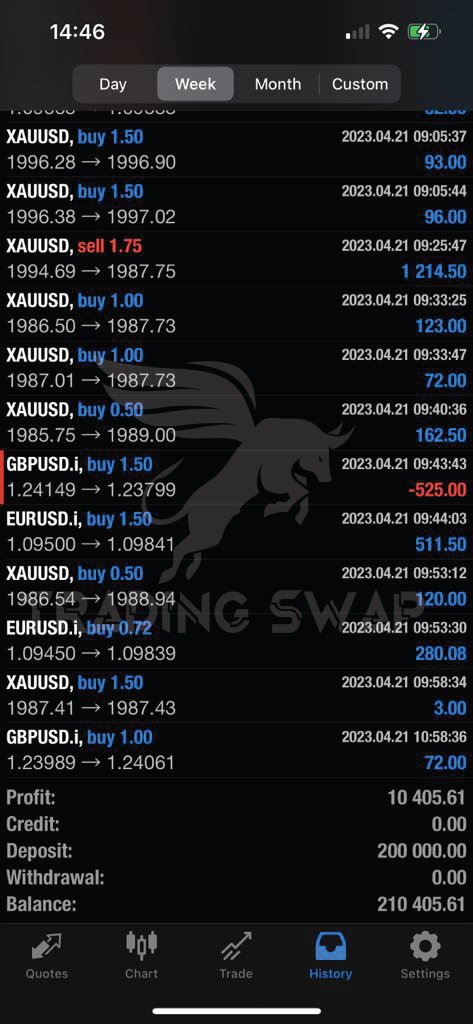
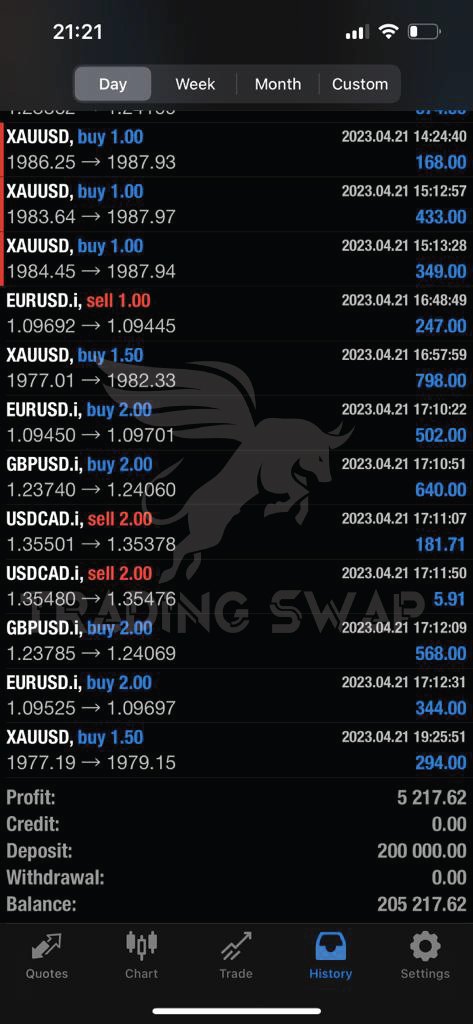
The premise behind it is to trade with minimal market exposure (short-term scalp trading), and solid risk management. Using a collection of sophisticated algorithmic tools, the strategy constantly analyses market movements to identify trading opportunities across the Foreign Exchange markets. While in those trades, the system continues to monitor performance and relates this back to the wider market to optimise profit.

There is a keen focus on risk and trade management; the goal is to enter the market, bank profit, and exit the market, as effectively and safely as possible.

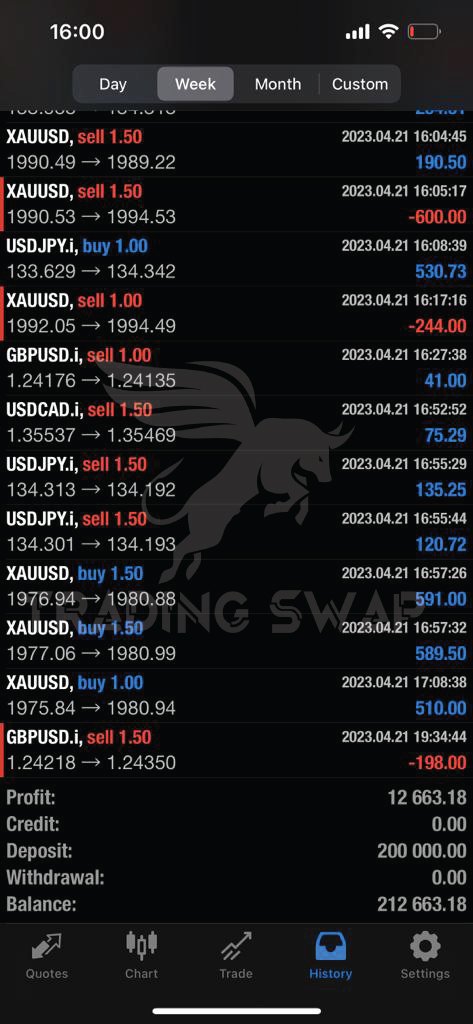
The aim is to preserve and grow Clients capital at a steady rate, ultimately providing customer satisfaction.

Intro

The figure on the left, breaks down the average percentage of trades allocated for each currency pair.

These pairs have been rigorously trialed and tested with the algorithm and have consistently been found to be the most profitable, with low downside risk in relation to drawdown.

Monthly Performance 2021/22

Use our backtested autotrader software that has a verified record totalling 30% growth over the last 3 months.

Outperforming Expectations: Exceeding the 7-10% Benchmark with Over 10% Returns in the First Month of 2024

In comparison to the wider market, our performance stands out prominently. As depicted in a recent Forbes article on investing (click here), a good annual return is typically considered to be in the range of 7-10%. It's noteworthy that achieving returns within this range is often viewed as a commendable accomplishment.

In the current fiscal year, we're excited to share that our results have already surpassed the anticipated annual return. In the first month of 2024 alone, our investment strategy has yielded returns exceeding 10%. This remarkable performance not only aligns with but also exceeds the expectations set by industry standards. We attribute this success to our meticulous approach to market analysis, strategic investment decisions, and an unwavering commitment to delivering exceptional value to our stakeholders.

Use our backtested autotrader software that has a verified record totalling 30% growth over the last 3 months.